Management
The Tasmanian shellfish fishery is managed by NRE Tasmania under the Living Marine Resources Management Act 1995 and Fisheries (Shellfish) Rules 2017. The Shellfish Fishery Policy Document and Shellfish Policy Update 2017 detail the harvest strategy for native flat oyster (Ostrea angasi) in Tasmania. A harvest strategy was developed in 2016 with limit reference points.
Catch (dozens), TACC (dozens), percentage of TACC caught, and estimates of area, biomass and total number from fishery assessments for O. angasi in Georges Bay St Helens since 2005.
| Fishing Season | Catch | TACC | % TACC | Effort | Est. area of fishery (m2) | Est. mean biomass (Kg/m2) | Est. total biomass (t) | Est. total number in fishery (millions) (millions) |
|---|---|---|---|---|---|---|---|---|
| 2005/06 | 2563 | 50 | ||||||
| 2006/07 | 2900 | 55.6 | ||||||
| 2007/08 | 3240 | 41369 | 7.831951 | 56.6 | 55,036 | 12.2 | 670.6 | 5 |
| 2008/09 | 1395 | 41369 | 3.37209 | 38.8 | ||||
| 2009/10 | 1677 | 39025 | 4.297245 | 50 | 69,895 | 8.2 | 569.5 | 4.7 |
| 2010/11 | 1507 | 39025 | 3.861627 | 28.8 | ||||
| 2011/12 | 940 | 39025 | 2.408712 | 17.6 | ||||
| 2012/13 | 2770 | 39796 | 6.960499 | 95.5 | 52,104 | 11.1 | 618.4 | 4.8 |
| 2013/14 | 1742 | 39796 | 4.377324 | 73.5 | ||||
| 2014/15 | 550 | 39796 | 1.382048 | 26.7 | ||||
| 2015/16 | 180 | 39796 | 0.452307 | 6.5 | 82,540 | 4.7 | 391.5 | 6 |
| 2016/17 | 615 | 21400 | 2.873832 | 59.5 | ||||
| 2017/18 | 3968 | 21400 | 18.54206 | 84.45 | 82,540 | 4.4 | 364.8 | 4 |
| 2018/19 | 6230 | 21400 | 29.11215 | 118.86 | ||||
| 2019/20 | 830 | 21400 | 3.878505 | 29.25 | ||||
| 2020/21 | 90 | 21400 | 0.420561 | 1.75 | 82,540 | 10 | 824.5 | 11.6 |
| 2021/22 | 1925 | 25330 | 7.599684 | 30.75 | ||||
| 2022/23 | 4938 | 25330 | 19.49467 | 77.35 | ||||
| 2023/24* | 1180 | 25330 | 4.658508 | 20.75 | 82,540 | 8.5 | 669.2 | 9.6 |
| * incomplete data | ||||||||
| ^ 50th quantile of bootstrapped mean | ||||||||
A formal TACC structure was introduced in 2007 with two associated commercial licences. TACC allocation is based on fishery surveys of estimated total biomass conducted every two to three years with the TACC set as equal to 10% of the estimated total biomass. In recent years’ market demand for native flat oyster has been weak, and consequently harvest levels are typically less than the available TACC.
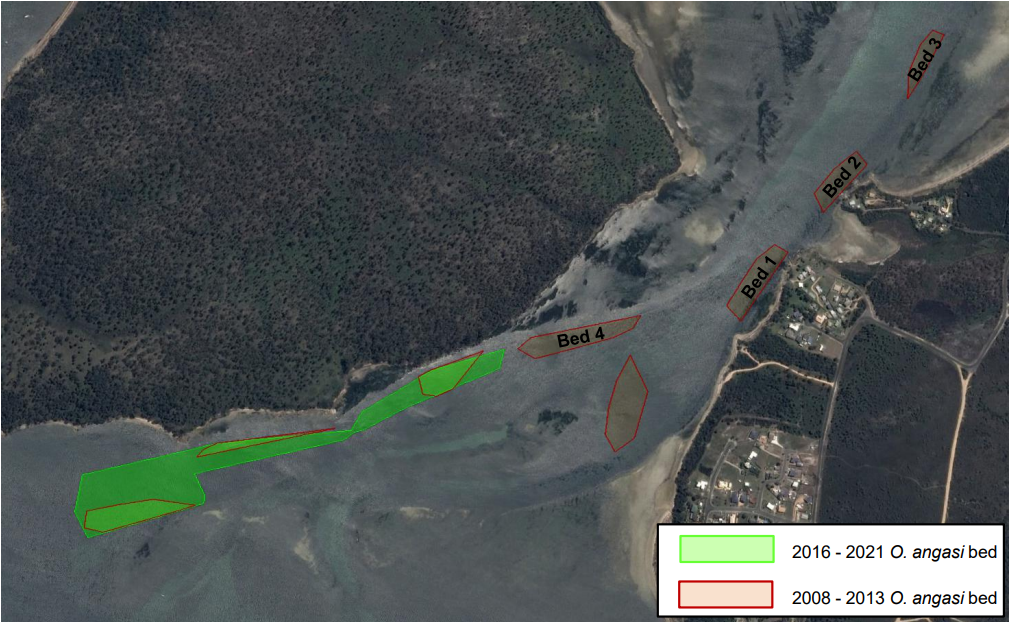
Map of Georges Bay O. angasi beds surveyed between 2008 to 2021. Total O. angasi area for 2016 – 2021 biomass surveys (green polygon) is estimated at 82,540 m2.
Harvest Strategy
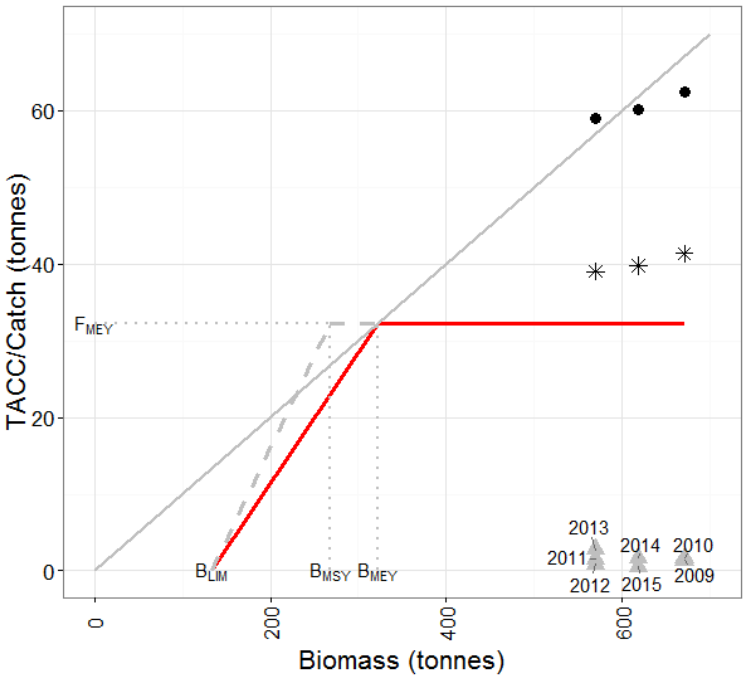
A harvest strategy (HS) with limit reference points for O. angasii was developed in 2016 to prevent overfishing of the stock should the demand for the product increase (Jones and Gardner 2016; DPIPWE, 2017). The HS, based on the Commonwealth fisheries harvest strategy (Smith et al., 2007), are employed:
BMSY is defined as the maximum average annual catch that can be removed from a stock over an indefinite period under prevailing environmental conditions. The Commonwealth HS guidelines suggest that the proxy for BMSY in the absence of more specific information be 40% of the unfished biomass (B0). Within the O. angasi fishery B0 is unknown however a proxy for B0 would be the maximum estimated biomass recorded in the fishery since its inception. This value is 670.6 T recorded in 2008 and as such could be used as the proxy for B0. This gives a BMSY = 268.2 t.
BMEY is considered the point at which sustainable catch or effort level across the whole fishery maximises profits. When a BMEY is unknown as it is in the O. angasi fishery, a proxy of BMEY = 1.2*BMSY may be appropriate. While this may over or underestimate the true value, if the unit cost of catch is dependent on the size of the stock, and practical discount rates apply, BMEY will always be larger than BMSY and in the O. angasi fishery is estimated at 321.8 t. Biomass increases above BMEY do not result in further increases in TACC, instead remaining at the TACC level reach at BMEY.
The biomass limit reference point BLIM is a key component in the HS. It defines the point at which a stock will be defined as “overfished”, and the point in the HS below which there will be no further targeted fishery on that species, and a stock rebuilding strategy has to be set in place. In general, BLIM should correspond to a level of stock depletion, at which the risk to the stock is unacceptably high, for example the point at which recruitment overfishing is thought to occur. The Commonwealth guidelines suggest in the absence of more specific knowledge that BLIM be set at 20% of the unfished B0. Based on this the TACC, for O. angasi would be zero when the estimated biomass or BLIM = 134.1 t.
FMEY is defined as Fishing mortality, i.e. the proportion of fish caught and removed by fishing, resulting in MEY. The current harvest fraction is set at 10% of the estimated biomass, thus FMEY = *0.1*BMEY, or 32.2 t.
The B0 proxy of maximum recorded biomass may underestimate or overestimate the true B0 resulting in similar uncertainty in the reference points. The underlying recruitment dynamics which drive production in this fishery are likely affected by environmental conditions but the exact relationship between biomass and recruitment in this fishery has not been explored. In the absence of a stock recruitment model, length frequency data collated from the biannual surveys should give some guidance on the acceptability of this value. Recruitment overfishing of mature biomass may result in decline of pre-recruits to the fishery and detection of this through the length frequency data may be used for revising BLIM.