Catch-MSY Results
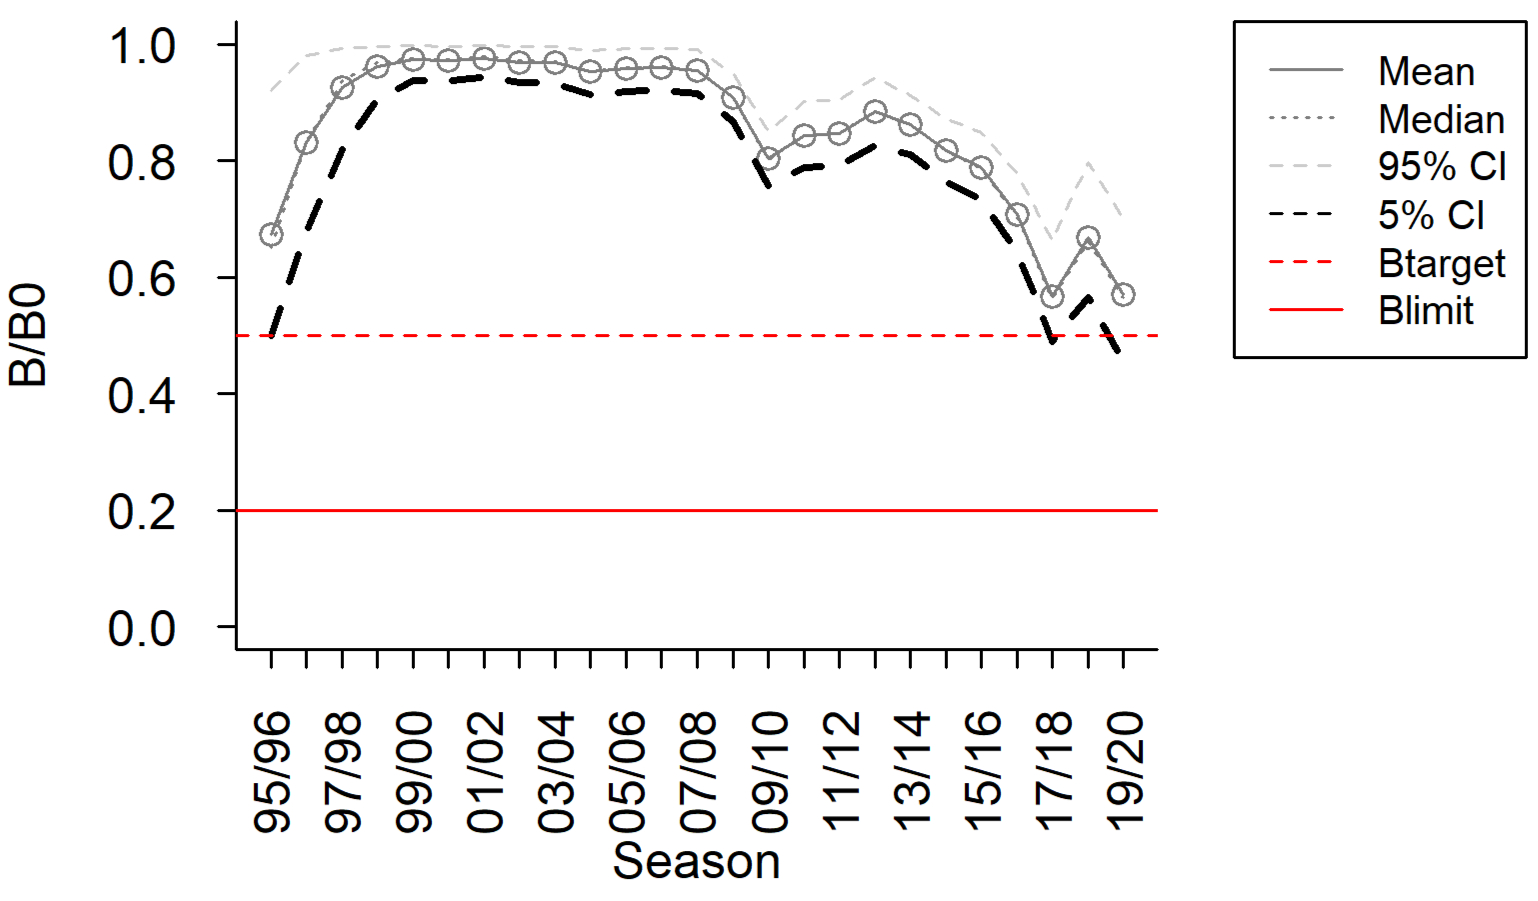
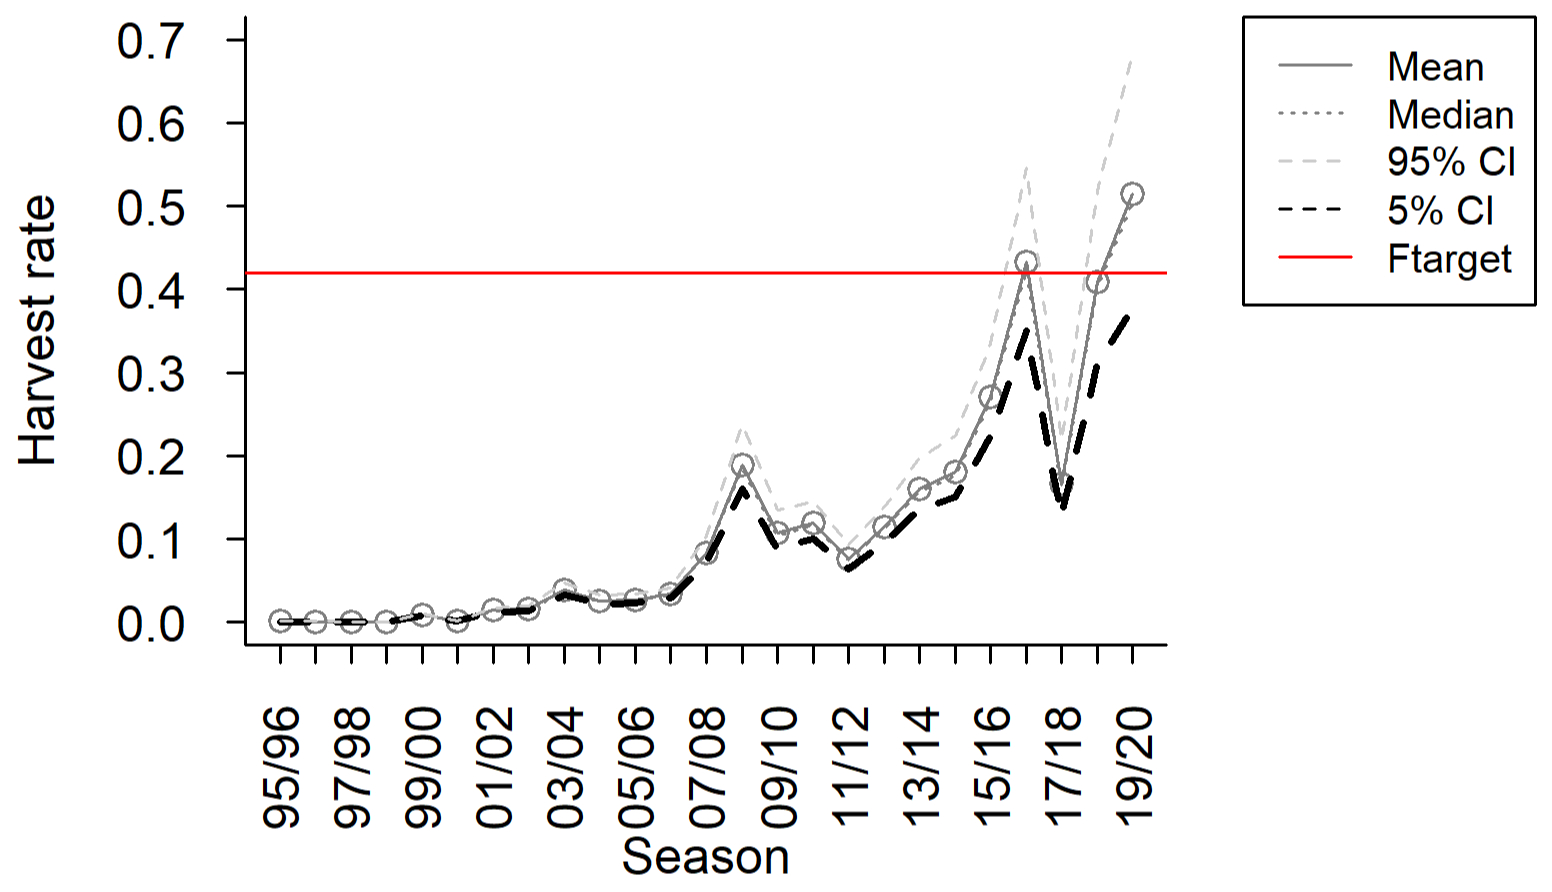
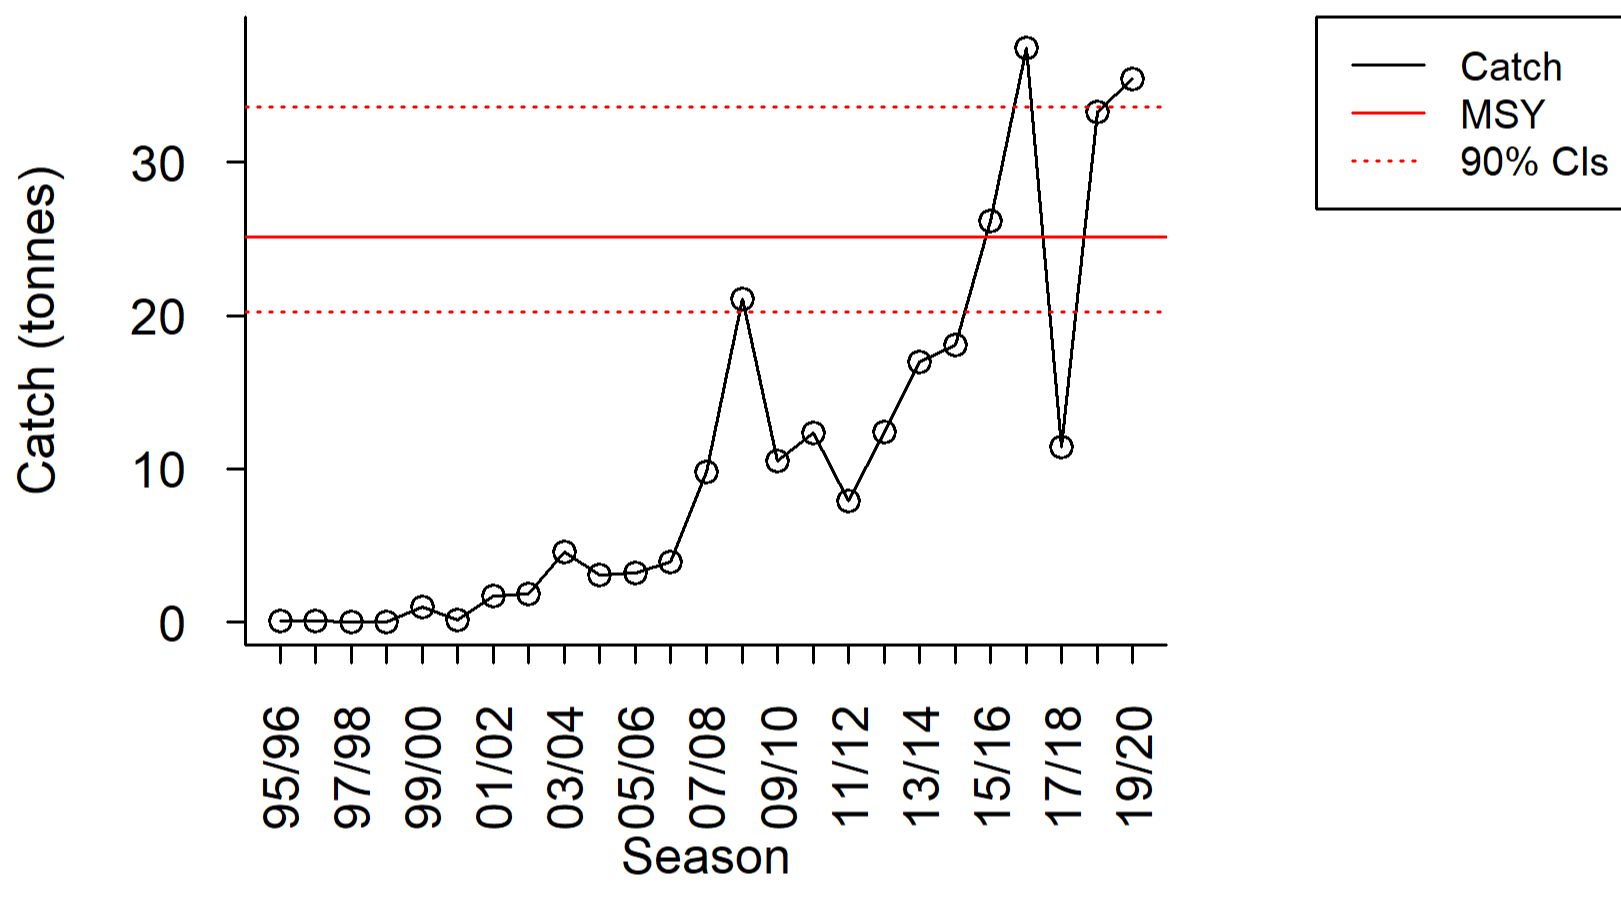
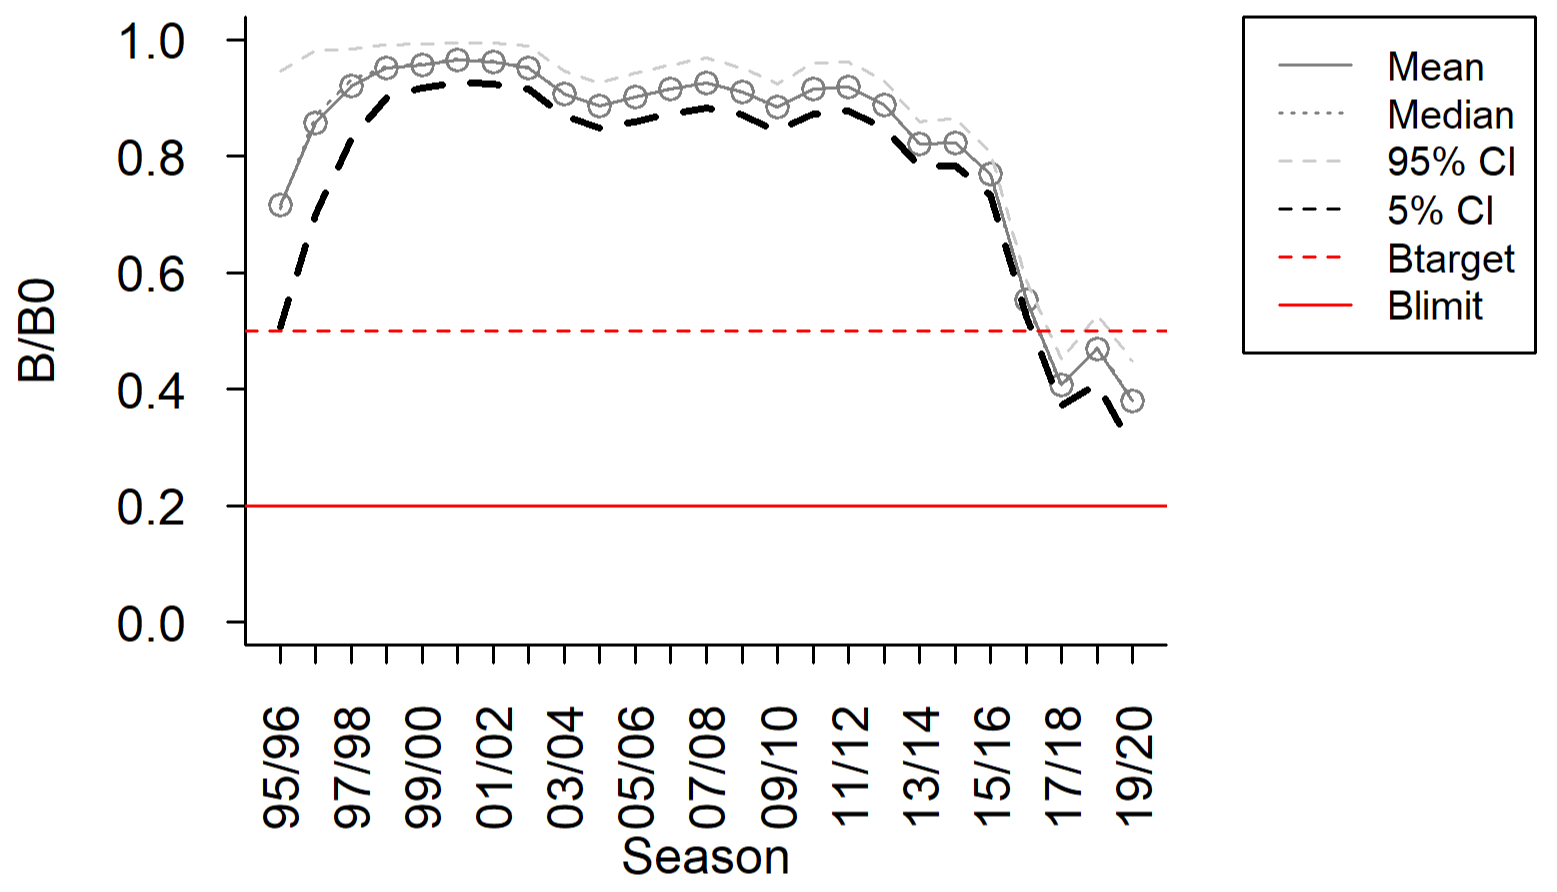
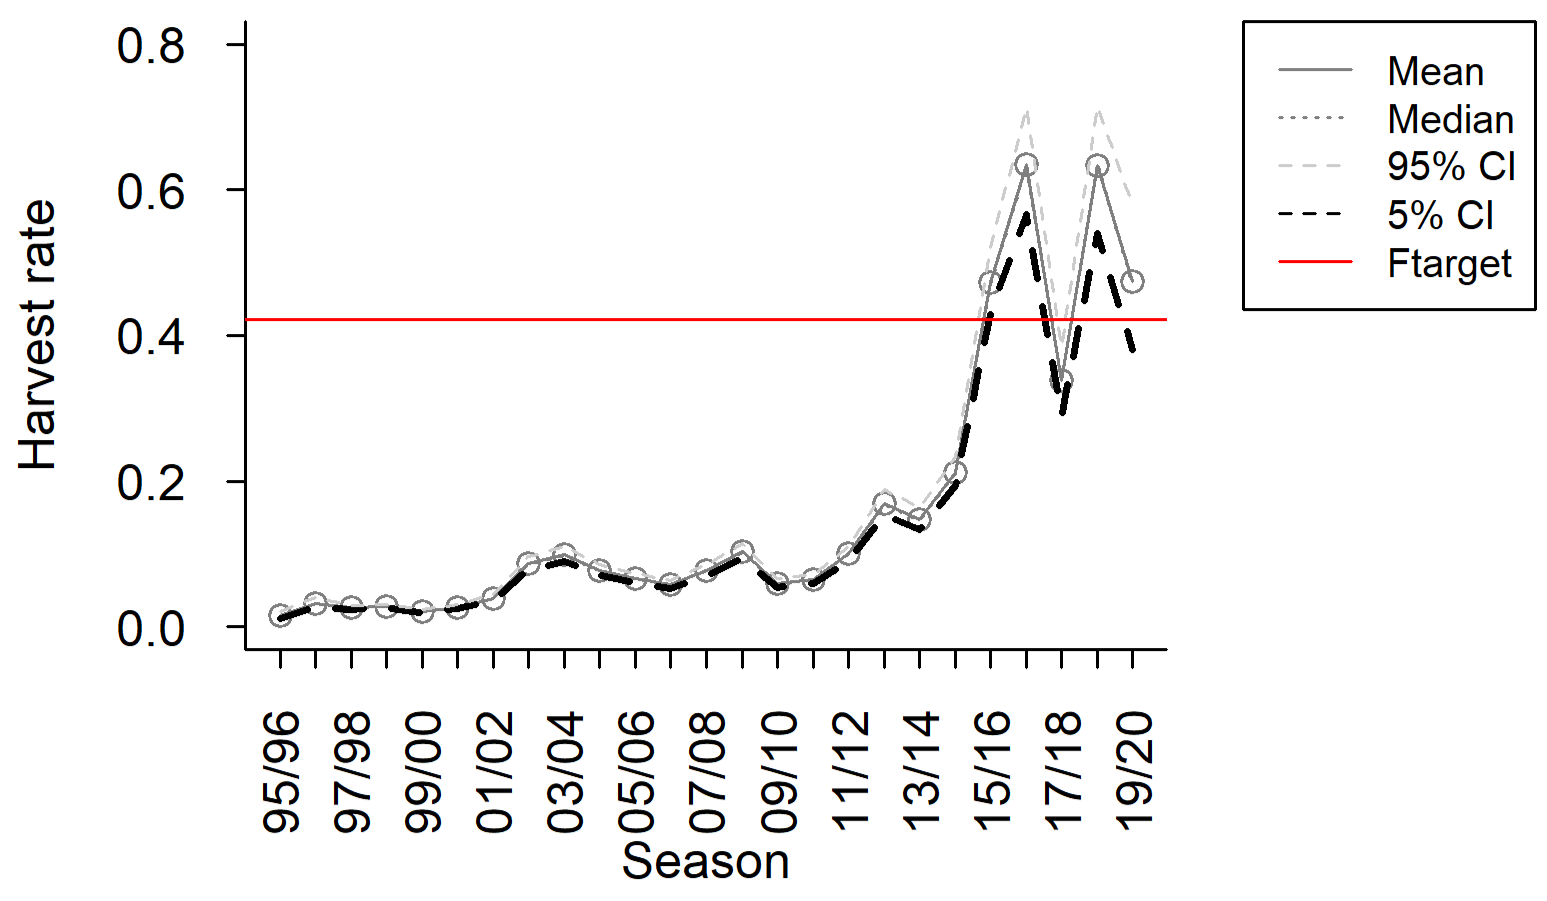
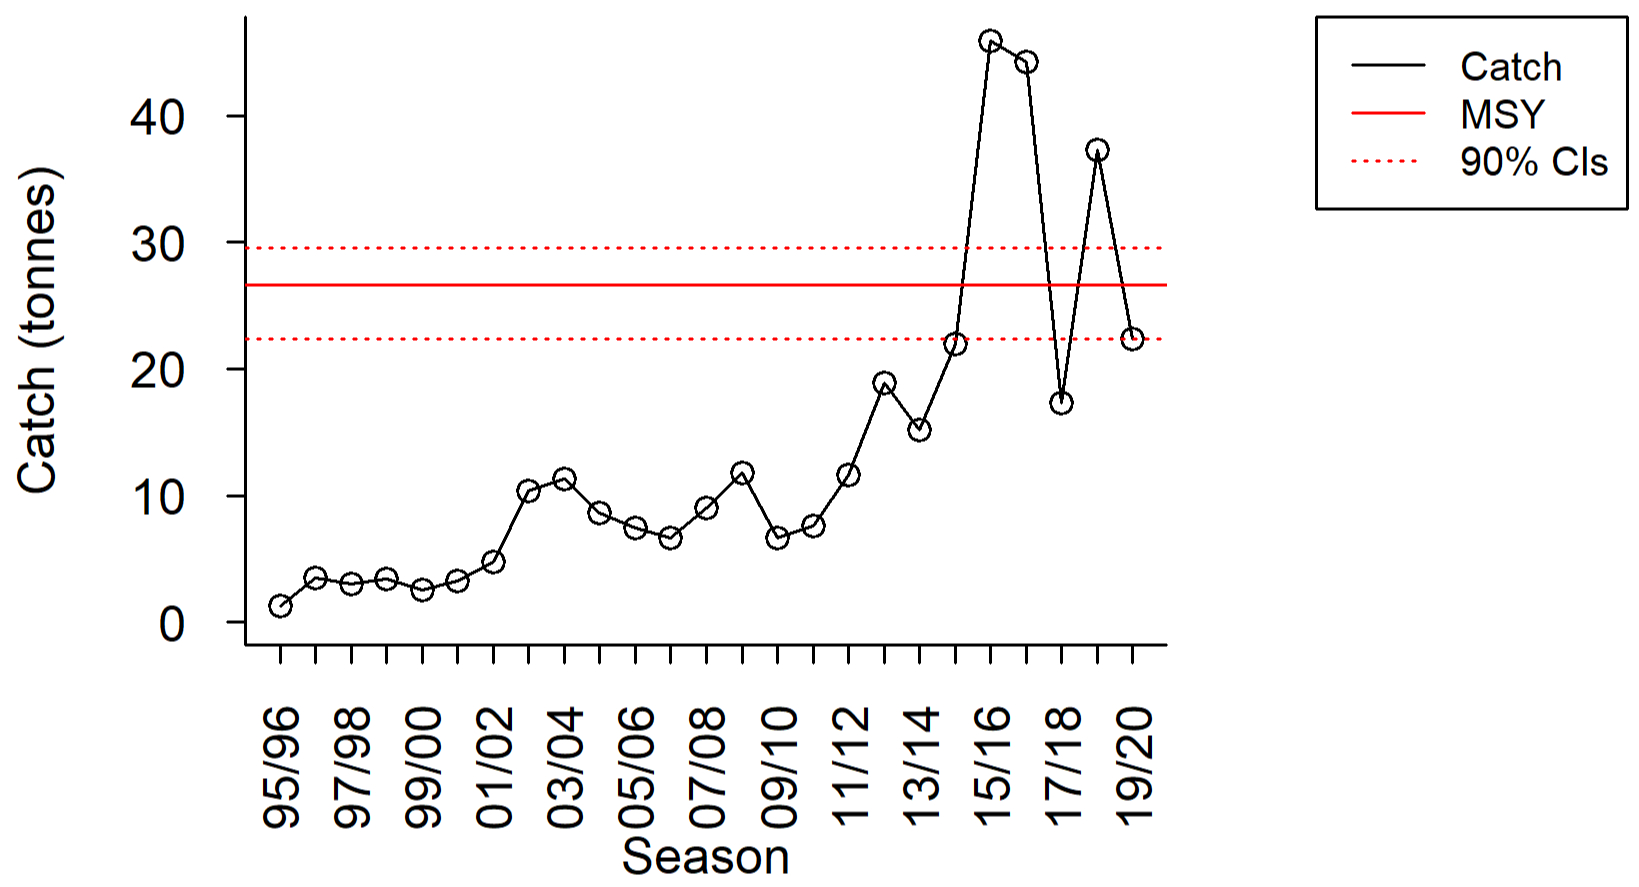
Catch-MSY results based on the assumption of “high” resilience are presented below for the northeast and northwest coast regions. Results suggest that Southern Calamari biomass is depleting in both regions (Figure 1, Figure 4). Estimates of harvest rates and catch indicate that fishing pressure may have started exceeding sustainable limits (northeast coast Ftarget = 0.43 MSY = 26.8, see Figure 2 and Figure 3; and northwest coast Ftarget = 0.47 and MSY = 25.0, see Figure 5 and Figure 6). Median estimates of biomass depletion in the northeast peaked at 38% of unfished levels (lower 90% CI = 30%) in 2019/20 (Figure 7). Median estimates of biomass depletion in the northwest peaked at 54% of unfished levels in 2017/18 (lower 90% CI = 49%) and were at 55% of unfished biomass in 2019/20 (lower 90% CI = 46%) (Figure 4). Results for initial key fishing grounds on the south-east coast and east coast are not shown here but indicate possible depletion beyond limit reference points (20% of unfished levels) associated with substantially reduced catches and harvest rates. Overall, the results indicate that Southern Calamari populations in these regions might be in a depleted state and that populations on the north coast might follow the same trajectory.
Northeast Coast
Northwest Coast