
Economic Contribution of Tasmania’s Scalefish Fishery
The fleet catching Common Jack Mackerel operates within the Tasmanian Scalefish Fishery.
Assessment of economic contribution is undertaken at fishery level. The data provided here is for the Tasmanian Scalefish Fishery as a whole, which includes harvesting activity for this species as well as all other species caught under this fishery.
Economic contribution estimates
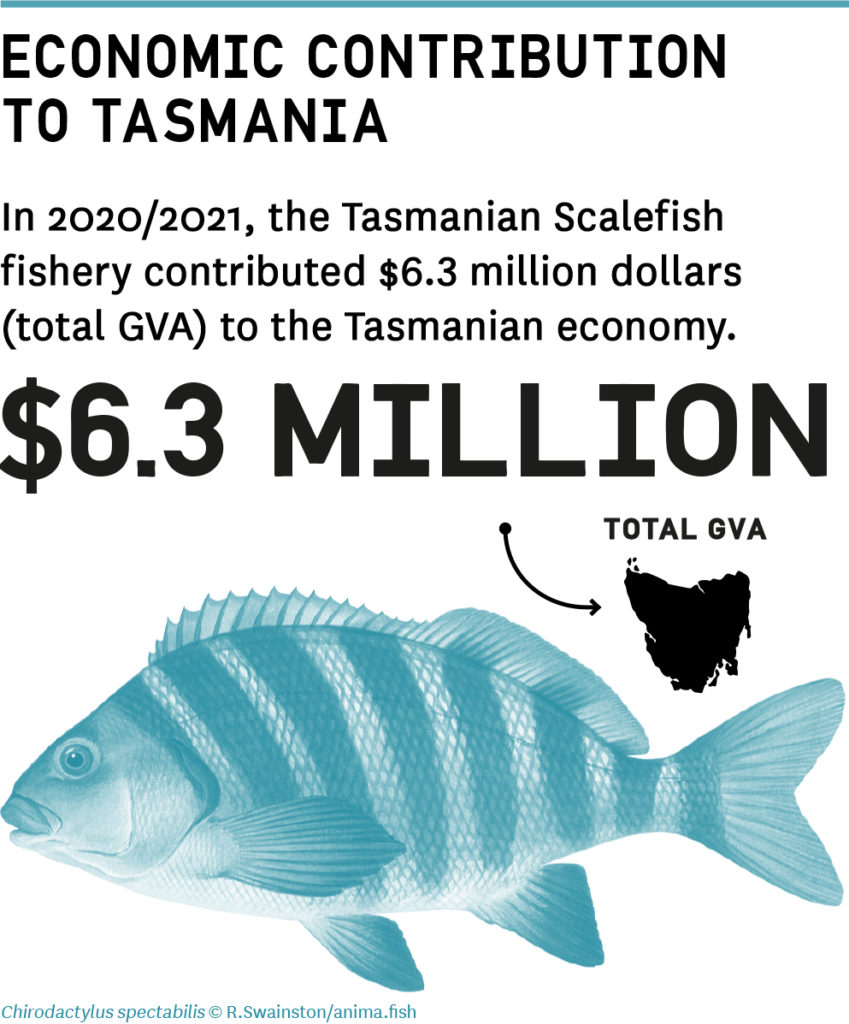
Commercial operators within Tasmania’s Scalefish Fishery generate an economic contribution to the Tasmanian economy through their production activities. Estimates are available for the 2018/19 financial year, as shown in the table below.
| Economic Contribution of Tasmanian Scalefish Fishery production to the Tasmanian Economy | 2018/19 | 2020/21 |
|---|---|---|
| Gross Value Added – Total ($m) | $5.3m | $6.3m |
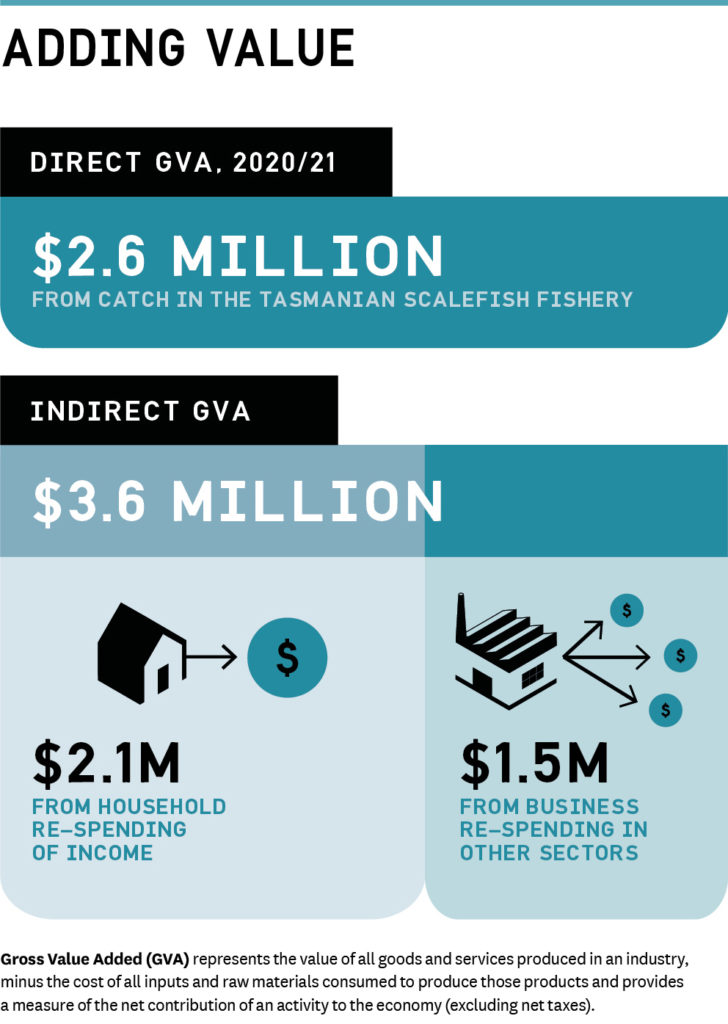
| Direct GVA ($m) | $2.5m | $2.6m |
| Indirect GVA ($m) | $2.8m | $3.6m |
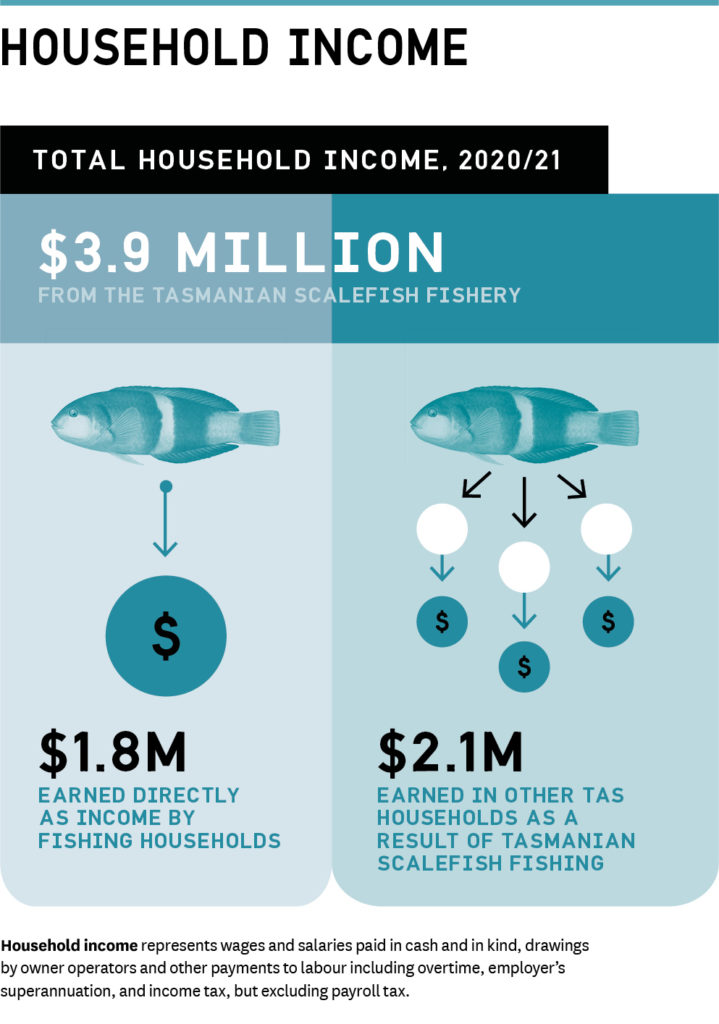
| Household Income – Total ($m) | $3.5m | $3.9m |
| Direct HI ($m) | $1.9m | $1.8m |
| Indirect HI ($m) | $1.6m | $2.1m |
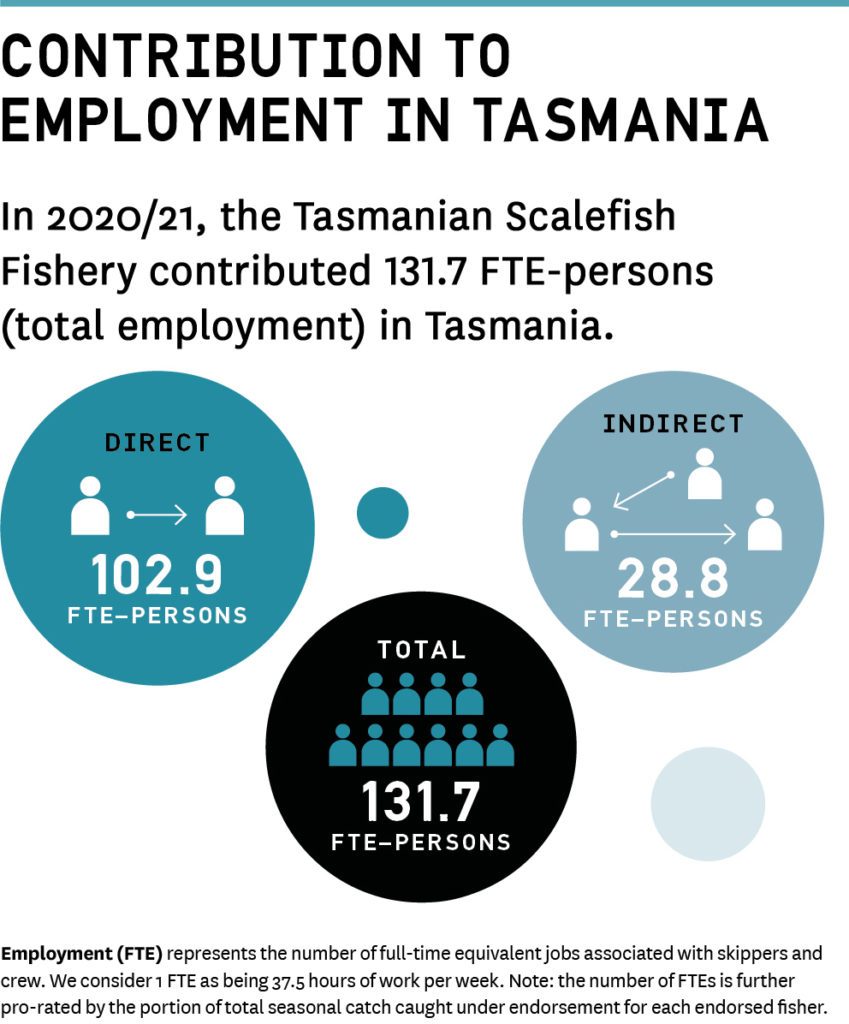
| Employment – Total (FTE) | 119 | 131.7 |
| Direct FTE | 98 | 102.9 |
| Indirect FTE | 21 | 28.8 |
Economic contribution indicators
Economic contribution is estimated using the following standard measures: Gross Value Added (GVA), Employment, and Household income (HI) generate by each sector to the Tasmanian economy1.
GVA represents the value of all goods and services produced in an industry, minus the cost of all inputs and raw materials consumed to produce those products and provides a measure of the net contribution of an activity to the economy (excluding net taxes). Household income represents wages and salaries paid in cash and in kind, drawings by owner operators and other payments to labour.
Estimates are reported for direct contribution, indirect (flow-on) contribution, and total contribution (the sum of direct and indirect contribution).
The direct effects arise from the initial spending of an industry sector into the other sectors of the Tasmanian economy. This includes the spending on wages (paid to employees) and the purchase of inputs (fuel, bait, fish feed etc.).
The indirect effects then arise from the re-spending of this money by households (the consumption induced indirect effect) or by businesses (the production induced indirect effect).
In the case of GVA and Household Income, results are shown for direct, production induced, and consumption induced components. For Employed Persons, results are shown for direct and total indirect. The total indirect effect is the sum of the consumption and production induced components.
1The input-output modelling was provided by BDO EconSearch (ABN 74 161 378 892) using economic profiles and analysis provided by IMAS.
Further information
For full details on how these estimates are generated see IMAS technical report Tasmanian Fisheries and Aquaculture Industry 2018/19 Economic Contributions:
Notes
The results do not include activities classified within the ‘seafood processing’ sector for the 2018/19 year. Results from the 2020/21 year onwards include the contribution of octopus fishing to the State economy.

Economic Contribution

Employment Contribution

Value Added

Household Income

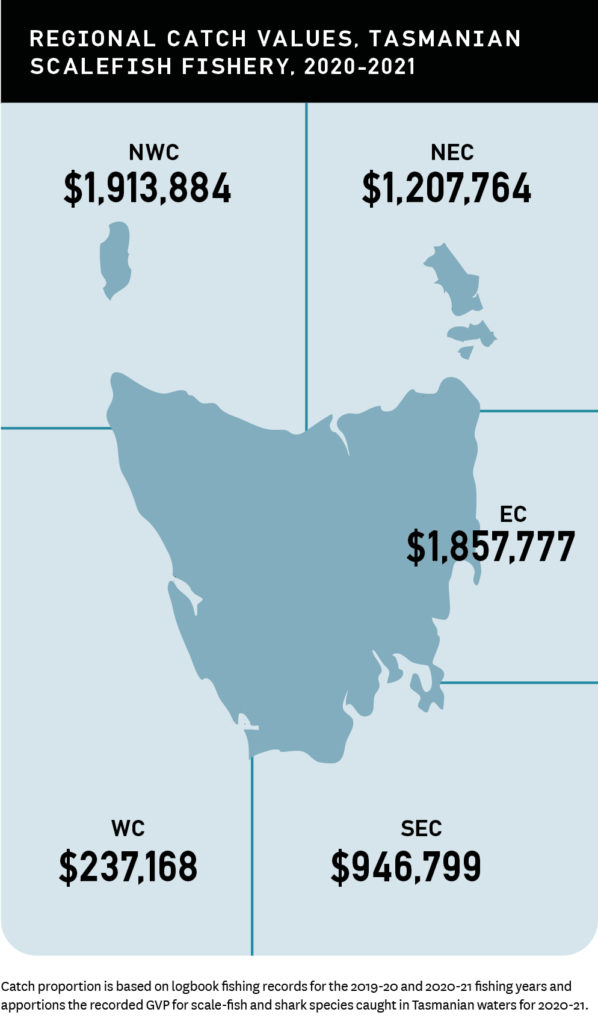
Regional Catch

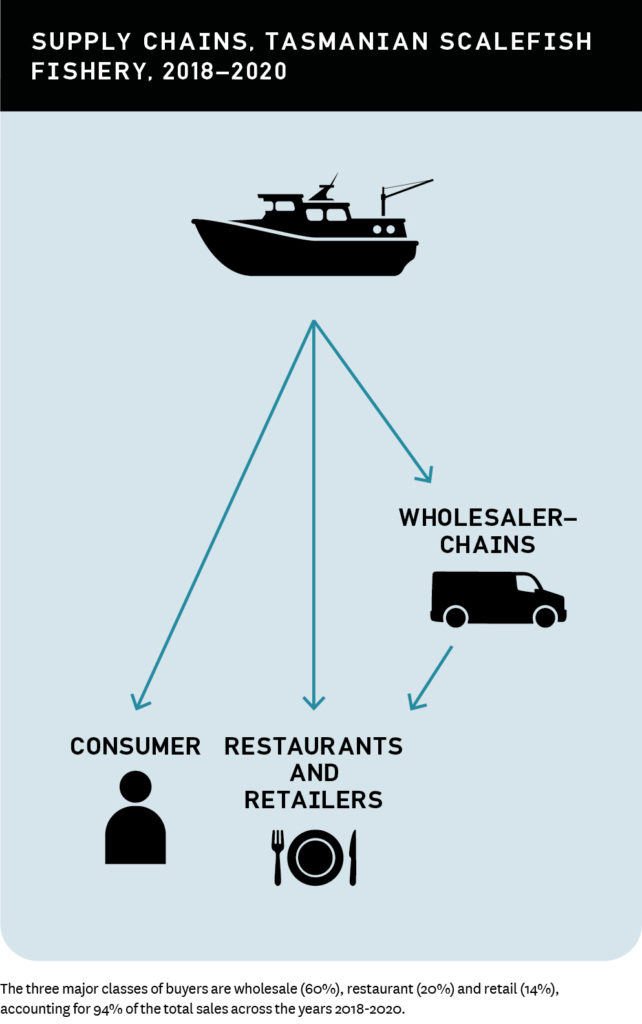
Supply Chains