
Assessment Model
A length-based stock assessment model for the Tasmanian giant crab fishery was introduced in Ziegler et al. (2009). In this assessment the same model has been used in conjunction with the new data available (new catch records and industry collected length frequency data). The model was applied to state-wide pooled data from the Western and Eastern side of the continental shelf (‘Tasmania’), and to the data from the two fishing regions independently (‘West’ and ‘East’). The results for the whole state allow the state of the entire fishery to be considered whilst the results for the two areas (‘West’ and ‘East’) permit spatial trends to be monitored. Current management arrangements such as TAC and size limits apply to the whole Tasmanian fishery, nevertheless considering the areas individually will highlight any spatial concerns and subsequent need for spatial management.
Due to its slow growth and longevity, Giant Crab is particularly susceptible to becoming recruitment overfished.
SAFS 2018
Catch Per Unit Effort (CPUE)
Commercial catch per unit effort (CPUE) are calculated from commercial logbooks. Logbook data prior to January 1995 do not include a measure of effort (number of traps), therefore, only data since the 1995/96 quota year can be used for calculating catch rates.
The data have been processed for a range of factors:
- Misreporting of effort was a common problem early in the fishery. Records that were known to be false or appeared unreliable, e.g. low trap number or unrealistic high catch rates, have been excluded from the analyses.
- Crabs are often taken incidentally to lobster fishing and catch rates under these situations are believed to be quite different to when crabs are targeted. The analysis of catch rates here was restricted to targeted effort. Fishers note in the current logbooks whether their effort is targeted towards giant crab, but this was not the case prior to 2000. As an alternative approach to defining targeted effort and to perform an analysis for the whole of the period since 1995/96, logbook data were restricted to skippers that had reported a median catch of at least 1000 kg over a minimum of 2 years. This selected experienced fishers who use vessels and gear more suited to crabs and take most of the overall crab catch, while fishers that directed most of their fishing effort towards lobsters and tended to have lower catches and catch rates were excluded.
For seasonal catch rate trends, catch rates were estimated as kilograms per pot day for each record in the database as:
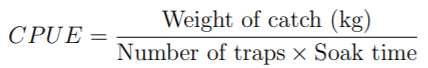
where pot days are defined as the number of traps multiplied with number of days the traps are in the water before being hauled (soak time). Although soak times greater than 7 days do not lead to increases in catch, capping soak times at 7 days had only minimal influence on the results and was not used.
Catch rates are used as a proxy for stock abundance in a fishery, however catch rates respond to a number of factors including the fishing block, month, skipper, depth and interannual variation in stock abundance. For example, a decrease in catch rates may be attributable to a new inexperienced entrant to the fishery or decreased stock abundance or a intra-annual shift in effort distribution. To address these concerns the catch rates here have been standardised using the methods detailed in Appendix 2 in Ziegler et al. (2009). This standardisation gives the best estimate of inter-annual changes in catch-rates not due to the previously mentioned confounding factors.