
Scoring functions for CPUE Performance Measures
1. Target CPUE
The objective of the Target CPUE PM is to maintain CPUE at or above a target value (i.e. 5 or greater on the PM scoring function). Following initial presentations of the MCDA Harvest Strategy at the June 2014 FRAG meeting, and at a subsequent workshop research/industry workshop (19/06/2014) it was agreed that an empirical process would be used to determine CPUE targets for each reporting block, based on mean annual CPUE back to 1985. A range of options for establishing appropriate CPUE targets were proposed included median annual CPUE (50th quantile), and more precautionary targets such as the 55th, 65th and 75th quantile of the annual CPUE. As the time series of data used to determine the CPUE target excludes the period of low CPUE during the late 1980’s and early 1990’s, a mildly precautionary approach using the 55th percentile was adopted.
The Target CPUE was determined for each statutory block, and scoring function implemented according to the magnitude of the CPUE Target (orange arrow). Where the current standardised CPUE is below the target CPUE, a low score is achieved (red arrow), and when the current CPUE exceeds the CPUE Target a high score is achieved (green arrow).
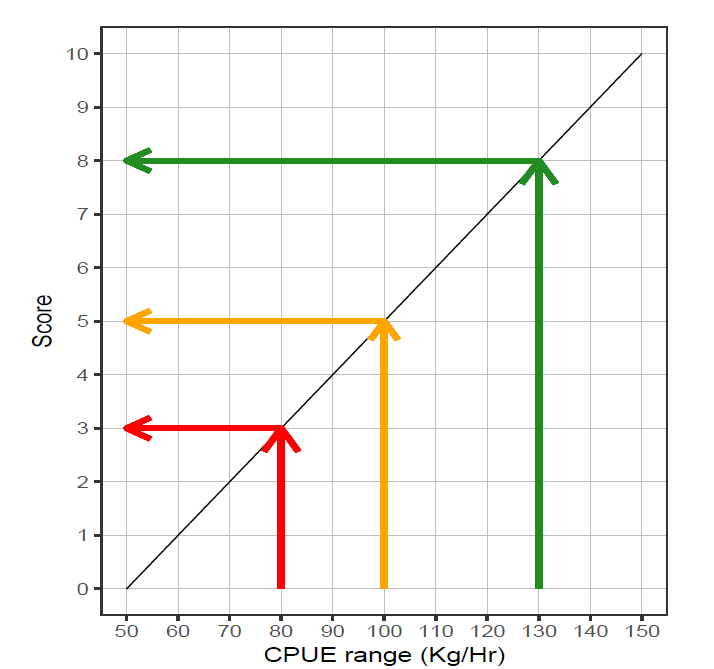
Illustration of the translation of an observed CPUE relative to a defined Target CPUE into an MCDA score. Two instances are shown, the CEb,T are 80 and 120 Kg/Hr and the ∆CE are 40 and 60 Kg/Hr.
2. Gradient 4 CPUE
The objective of this scoring function is to recommend positive increases in the TACC if the gradient of CPUE over a four year period is increasing (provisionally n = 4) and conversely it recommends decreases in the TACC if that gradient is negative. The assumption is that where TACC is constant or decreasing, and a negative CPUE gradient is observed, the harvest level is likely to exceed recruitment to the fishery. As CPUE is a relative measure for particular spatial assessment units, so the changes in CPUE through time need to be converted to proportional changes through time otherwise areas of different productivity would be treated differently.
CEb,y is the CPUE in block b in year y, and pCEb,y:z is the proportional change of CPUE in year y relative to year z. If w years are used as the comparative period then z = y0 −w−1, and x = 0..w−1, where y0 is the current year. Thus if w is four years,
The performance measure is the gradient of the linear regression between the pCEb,y and the sequence 1..w:
With limits imposed such that the score is constrained between 0 – 10. If these limits are reached often or never reached, then the range of potential changes (−a–a) would need to be modified. For this assessment, the range of observed slopes over the reference period for each individual block is extended by 10%, with −a and a set as the lower and upper extent of the extended range. As for the CPUE Target example, where the current CPUE gradient is below the target of zero a low score is achieved (red arrow), and when the current CPUE gradient exceeds the Target a high score is achieved (green arrow).
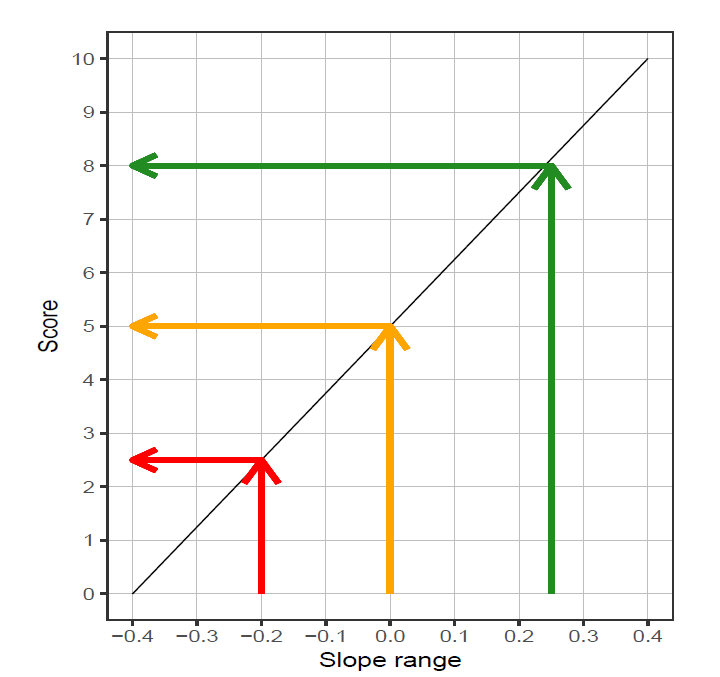
Illustration of the translation of CPUE gradient across a four year period into a score.
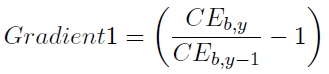
3. Gradient 1
The objective of this scoring function is to highlight occasions when performance of the fishery is changing rapidly. Thus where rapid increases in CPUE between the current year and the previous year are observed, it acts in addition to the Gradient 4 PM to recommend increases in TACC, and conversely recommend decreases in the TACC if there are recent rapid decreases in CPUE. The scoring function process for Gradient 1 is the same as for Gradient 4.
CEb,y is the CPUE in block b in year y and this is used to calculate the performance measure Gradient 1: