

Assessment Method
Stock assessments are conducted annually for selected species within the Scalefish Fishery, including teleost (a diverse group of ray-finned fishes) and cephalopod fisheries under Tasmanian jurisdiction and some species under Commonwealth jurisdiction that are also taken in state waters by state-licensed operators. Formal assessments of species under Commonwealth jurisdiction (e.g., Tiger Flathead, Blue Warehou, Jackass Morwong, Ocean Perch, School Whiting, Blue-eye Trevalla, Blue Grenadier, School and Gummy Shark) are undertaken by the Southern and Eastern Scalefish and Shark Fishery Assessment Group (SESSFAG) and summarised in fishery status reports produced by the Australian Bureau of Agricultural and Resource Economics and Sciences (ABARES; e.g., Patterson et al. 2021).
Data Sources
Commercial catch and effort data used in the stock assessments are collected through compulsory Tasmanian Commercial Catch, Effort and Disposal Returns and combined with Commonwealth non-trawl (GN01 and GN01A) and Southern Squid-jig Fishery (SSFJ) logbook returns. Unless noted otherwise, catch and effort data reported in the stock assessments relate to the commercial sector. Catch and effort information for the recreational sector are collected from surveys that are conducted periodically.
Tasmanian General Fishing Returns
The catch and effort logbooks have been amended several times (1995, 1999, 2007, 2010 and 2013) to report at finer spatial scales and provide greater operational detail. While the offshore fishing blocks are still at the 30nm (1/2 degree) spatial resolution, the logbooks introduced in 2010 have redefined the scale of the coastal blocks. Analysis of catch and effort information reported in the Fisheries Integrated Licensing and Management System (FILMS) requires data restrictions and quality control measures, which are detailed following the link below. FILMS data quality control procedures are currently under review to improve the precision of catch and effort information for future assessments.
Commonwealth Catch Returns
Following the introduction of the Commonwealth non-trawl logbook (GN01 and subsequent versions) in late 1997, dual endorsed Tasmanian and Commonwealth (South East Non-Trawl and Southern Shark) operators generally commenced recording all of their catch and effort data, including fishing in State waters, in the Commonwealth logbooks. In addition, several dual endorsed squid operators reported some or all their state waters fishing activity in the Southern Squid-jig Fishery (SSJF) logbook. As most of these operators did not explicitly indicate whether fishing occurred in State or Commonwealth waters, it has been necessary to incorporate all activity reported from coastal fishing blocks in the analyses.
During 2001, dual endorsed fishers were instructed to report all fishing activities under State jurisdiction in the Tasmanian catch and effort logbooks. This should have removed the necessity to include subsequent Commonwealth catch and effort data into analyses, but it has become apparent that there was some confusion amongst fishers about reporting requirements. For example, catches of species such as Striped Trumpeter taken by Commonwealth operators were not routinely reported in the Tasmanian catch returns. Commonwealth logbook data since 2001 have been available for the current assessment and have been checked for possible double reporting (i.e. on both the Tasmanian and Commonwealth catch returns) and where this was not the case, the catch and effort database used in this assessment was updated.
Data Analysis
For the purposes of this assessment, effort and catch rate analyses are restricted to commercial data provided for the period 1st July 1995 to 30th June in the most recent fishing year.
A fishing year from 1st July to 30th June in the following year has been adopted for annual reporting. This better reflects the seasonality of the fisheries for most species, where catch and effort are generally concentrated between late spring and early autumn, rather than reporting based on calendar year. In addition, it better encompasses the biological processes of recruitment and growth for most species. Unless otherwise stated, data have been analysed at state-wide and regional levels. Five broad assessment regions are used: southeast coast (SEC), east coast (EC), northeast coast including Flinders Island (NEC), northwest coast including King Island (NWC), and west coast (WC).
There are 14 main fishing methods used in the Tasmanian Scalefish Fishery. For assessment purposes, effort has been primarily expressed in terms of number of days fished using the specified gear type, irrespective of the amount of gear utilised each day. Since a variety of gear types are represented, in some cases it has been necessary to additionally express effort in gear units appropriate to each specific fishing method. Although days fished represents a less sensitive measure of effort, it has become apparent that some fishers have misinterpreted reporting requirements for effort. Attempts have been made to reduce this problem by updating the logbook; however, confusion about the new reporting requirements can bias some effort measures. Examining effort in terms of days fished overcomes any uncertainty about the reporting of effort units and provides consistency through time, assuming that there have been no major changes to fishing practices over the duration of the time series (1995-most recent fishing year).
Catch returns for which effort information was incomplete or unrealistically high or low (either due to data entry error or misinterpretation of information requirements by fishers), were flagged and excluded when calculating effort based on gear units or catch rates based on catch per unit of gear. However, all records were included for reporting catch, days fished and catch per day.
Learn more about the scalefish stock assessment model at the Uncertainties and Implications for Management Page:
Since catch rate data are typically log-normally distributed, the geometric rather than arithmetic mean of individual daily catch records has been calculated when generating catch rate statistics. The geometric mean is calculated as the nth root of the product of individual catch rates (yi):

This is equivalent to computing the arithmetic mean of the natural logarithm of each number, and then taking the exponent:
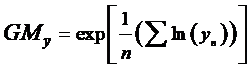
Catch rates calculated with this method may differ slightly from the more simplistic approach of dividing total catch by total effort or using the arithmetic mean. The advantage of calculating the geometric mean is that results are less affected by relatively few, outstandingly high data points, which are characteristic of log-normally distributed data.
Recreational Fishery
Information on recreational fisheries in Tasmania is relatively sparse in comparison to commercial data. Detailed analyses of the Tasmanian recreational fishery are available from the National Survey in 2000/01 (Lyle 2005) and state-wide surveys conducted in 2007/08 (Lyle et al. 2009), 2012/13 (Lyle et al. 2014a) and 2017/18 (Lyle et al 2019). Additional data are provided by targeted surveys of the offshore recreational fishery (Tracey et al. 2013), recreational gillnet fishery (Lyle and Tracey 2012) and fishing practices (Lyle et al. 2014b), along with recreational net licence numbers.