Assessment Data
Fishery-dependent Data Sources
Fisher returns
The primary data used in this assessment are sourced from fishery-dependent catch and effort logbook data. A research program has been in place at the IMAS Taroona laboratories to collect biological data on growth rate and reproductive maturation for several decades. There is however no strategic collection of fishery-independent abundance data or a time-series of fishery independent data on population size structure. The system for capturing Catch and Effort returns from fishers, and the requirements for reporting have changed since the inception of the fishery. Some of the original data is no longer available, and the working time series commences in 1974. From 1974 to 1991, the data are contained in archived extracts in electronic form from an original reporting system. Noting that computer systems and databases were not available in the 1970’s and were unlikely to be mainstream in Government departments and agencies until at least the mid 1980’s. A new production database was implemented in 1992, with an entirely new relational database structure. The 1992 production database was replaced in 1997, with minor structural changes. A further complication arises in 2000 with the introduction of defined management zones (Eastern Blacklip Zone , Western Blacklip Zone, and Greenlip Zone) each with their own TACC, and with the introduction of finer scale reporting sub-blocks. Further spatial partitioning of the blacklip fishery occurred in 2001 (Northern Blacklip Zone), 2003 (Bass Strait Blacklip Zone), 2009, 2013 (Central Western Blacklip Zone), and 2018 (Central Western, Northern and Bass Strait Zones). Several of the Zone boundaries were created at sub-block boundaries rather than block boundaries, which creates challenges for linking historic block level trends to current sub-blocks which are now split by zones.
In the Tasmanian Abalone Fishery catch, effort and location are reported daily. As database structures are upgraded and operational rules are modified over time, this triggers changes in the data, including frequency of returns, whether the diver or the skipper was required to submit the returns, and the spatial scale of reporting. Since 1992 the diver has been required to submit catch dockets for every fishing day within a short mandatory return period, usually 48 hours. Up to and including 2000 catch and effort was reported by Block with 57 reporting blocks encompassing the coast of mainland Tasmania and offshore islands, and from 2001 the majority of reporting Blocks were split into between two and five sub-blocks. Currently, fishers are required to report estimated weight of catch and effort in each sub-block for each day of fishing, with a hard copy of the docket submitted within 48 hours.
Factory Measuring of Length-Frequency
Collection of length-frequency data from samples of landed commercial abalone catches (catch sampling) was patchy up to 1998 with no data collection occurring within large blocks of years. From 1998, a trial photographic catch sampling program was implemented, with divers submitting photographic samples of their catches with details of the location from where the catch was taken. The photographic program was terminated in 2000 due to inconsistencies in the photographs and a declining participation.
Between 2000 and 2008, diver’s catches from around the State were routinely sampled by IMAS research staff at abalone processing factories. For each catch sampled, a tray or crate of abalone was selected at random and the first 100 abalone from that sample measured. Most samples were obtained from catches landed from the south east and east coasts. The reason for this focus was the challenge of identifying source locations of abalone landed within multi-day, multi-diver, multi-block fishing trips to the west coast and northern remote islands. Catches from the north and west coasts have also been sampled, at a lower frequency. The majority of samples obtained are from the blacklip fishery, but a small amount of samples from the greenlip fishery have been sampled although with patchy spatial coverage. Since 2008, market measuring has been undertaken by several of the major processors who together process over 50% of the Tasmanian blacklip catch. Processor staff measure samples of 100 abalone from catches using electronic measuring boards. Length measurements were obtained using the same IMAS supplied electronic measuring board and protocol used by IMAS staff described above. From 2015 the catch sampling program declined due to difficulties in maintaining voluntary participation in the program despite the efforts of IMAS staff.
Geo-referenced Fishery-dependent Data
Fine spatial scale information has been routinely obtained from fishers in the Tasmanian Abalone Fishery since 2012. This was achieved by issuing all commercial abalone divers with a robust vessel GPS receiver/data logger unit with internal Lithium Ion battery, encased in an IP65 housing, and an submersible depth/temperature logger. The position data loggers were pre-set to record standard National Marine Electronics Association (NMEA) strings (RMC, GSA) at 10 second intervals to a standard SD memory card. An important component of monitoring activity of a dive fishery is the depth profile at which fishing occurs. The depth data loggers (Sensus Ultra, Reefnet Inc), also pre-set to record at 10 second intervals, were attached to each fishers weight vest. The depth loggers commence logging when pressure exceeds a pre-set pressure threshold, typically equivalent to 0.5m depth (1111 mBar), and cease logging when pressure drops below that threshold, providing an automated system for determining when fishing is taking place.
At three monthly intervals the GPS and dive loggers, are exchanged to enable data retrieval. The separate position and depth data streams are merged on the date/time stamp, and position data are filtered so that only position information is used where fishers are diving. This provides a data stream of date/time, position, depth and temperature at 10 sec intervals for the duration of every dive. The position and depth data streams are merged on the date/time stamp, and position data are filtered to exclude non-diving position data. The data are archived in a SQL Server database utilising Open
Geospatial Consortium (OGC) compliant geometry data types to store the raw position data as spatial points. Details of the dataloggers, database and analytical methods applied to the spatial dataset are described in detail by Mundy (2012).
In this assessment several spatial indicators are presented as supporting indicators for the CPUE based performance measure. As a measure of the gross area supporting the fishery, a zone level count of the number of hexagonal grid cells where a minimum of 30 minutes of fishing was observed is provided, along with the reported catch divided by the number of hex cells as a measure of average productivity per hex cell. For each reporting block, three simple spatial indicators area presented –Kilograms Landed/Hectare (KgLa/Ha), Maximum dive distance (Max Distance), and metres of reef fished/Hour (Lm/Hr). All three spatial indicators are derived from the spatial dive data, with the dive area obtained from the area of the bivariate Kernel Utilisation Distributions (KUD) 90% isopleth. The 90% isopleth identifies the maximum footprint of the dive, but the area actually searched by the diver is typically much less. The distance measure used in the Max Distance and Lm/Hr spatial indicators are derived from the maximum distance between any pair of vertices on the 90% isopleth for a given dive (Mundy, 2012; Mundy et al., 2018b). These three indicators provide alternative information about fishing performance, and combined with CPUE (Kg/Hr), provide all possible combinations of weight, time and area (weight/time, weight/area, and area/time).
Effort captured on the GPS and depth data loggers is summarised by 5 m depth bands (0 -5, 5 -10, 10 -15, 15 – 20, > 20) in order to assess changes in the proportion of fishing effort across the normal depth range. This is achieved by summing the number of points in the raw XY data series within each depth band, pooling across divers. The recording frequency of the depth and GPS data loggers is 10 seconds, thus six points equates to one minute of fishing effort. Catch rate (CPUE Kg/Hr) is also calculated for each depth band, using the average dive depth from the KUD 90% isopleth. Summary figures are only presented for area where there has been substantial change over the six year data period (2012 – 2017).
The total area of reef utilised to land the catch taken is determined by an overlay analysis of the raw position/depth spatial points dataset with a 1Ha Hexagonal grid (Mundy, 2012; Mundy et al., 2018b). This analysis provides a summary spatial grid dataset with the total annual effort in minutes, total catch, and number of divers working in each 1 Hectare grid cell. This spatial grid database is used here to produce concentration area curves as a measure of changes in overall reef area utilised to support annual harvests, and any changes in the inequality or spread concentration of harvest across the total reef area.
Fishery Independent Research Surveys
Historically there has been a paucity of fishery independent abundance and population size structure information collected in the Tasmanian Fishery. Primarily this has been a consequence of the geographic scale of the fishery relative to available field resources, along with the challenges of obtaining representative samples where abundance is patchy on multiple spatial scales from meters to kilometres. Juvenile abalone (i.e. below the size at reproductive maturity) are entirely cryptic. The size at emergence from crypsis for blacklip abalone in Tasmania is around the same size as the size limit, creating challenges in quantifying density and size structure of sub-legal size classes using traditional FI survey techniques. Monitoring of cryptic abalone (2+ to 4+ year classes) using Abalone Recruitment Modules (ARMS) could provide an early warning of a potential reduction in future fishable biomass, and address the inability of visual surveys to quantify change in density of these smaller size classes. From the early 2000s effort has been applied to developing suitable survey methods quantifying abundance for the Tasmanian abalone fishery, with robust sampling methods developed during FRDC projects 2001-074, 2005-029 and 2014-010 (Mundy et al., 2006, 2010, 2018a). Since 2015 IMAS have conducted a pilot program to collect fishery independent data for cryptic (ARMs) and emergent abalone (LEGs).
Monitoring of juvenile abundance with Abalone Recruitment Modules (ARM)
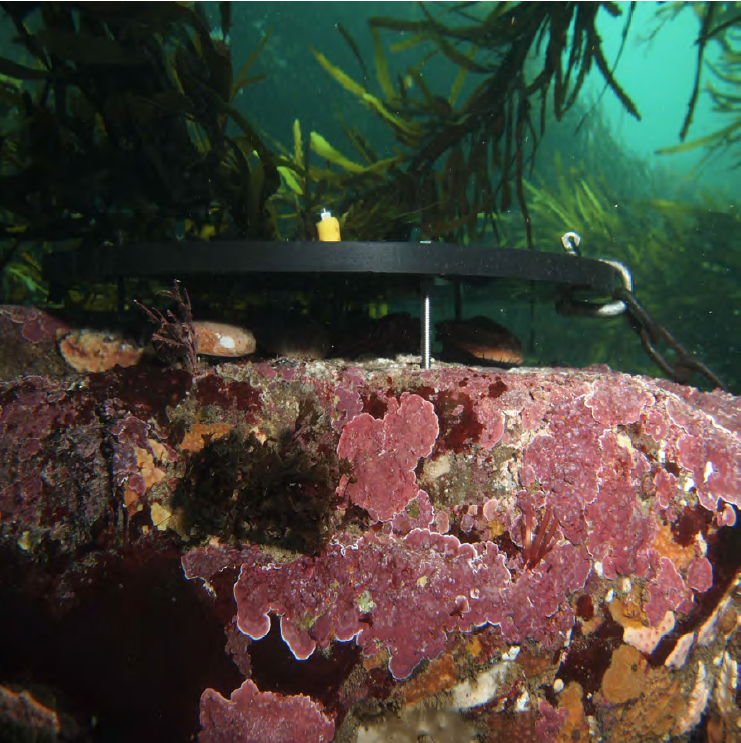
Juvenile abalone are currently monitored using an artificial habitat or abalone recruitment module (ARM) developed by IMAS which consists of a flat plastic disc secured to the reef to create a cryptic space underneath (see figure below). The Tasmanian ARM design provides data on cryptic blacklip abalone in a size range (6 mm – 100 mm). Strings of 20 ARMs per site are currently maintained to account for high local scale variation in recruit abundance. Initial trials suggest this is the minimum number of ARMs required per site to detect a magnitude of 80-100% change in abundance (Mundy et al., 2018a). Paired sites separated by approximately 50 m are established to examine local scale variation in juvenile abundance.
ARMs are deployed at six sites along the east coast of Tasmania (i.e. n = 12);
- The Gardens (GAR)
- Seymour Point (SEY)
- Betsey Island (BET)
- George III Rock (GEO)
- Black Reef boulder (BRB)
- Black Reef slab (BRS)
Where possible sites are surveyed seasonally (Summer, Winter, Spring), and all abalone found under the ARM are measured to the nearest millimetre. Seasonal data have been collected since 2015 and IMAS continue to assess the performance and suitability of ARMs as a recruitment indicator. Data presented in this fishery assessment are useful as a secondary indicator only and were not used for as input to the Empirical Harvest Strategy due to limited coverage and short time-series of data collection.
Length Evaluation and Growth Surveys (LEGs) of Emergent Abalone
Permanent Length Evaluation and Growth survey (LEGs) sites have also been established at the same locations where each ARM string (n = 12) is deployed to establish a time-series of abalone abundance and size structure as a relative measure of stock performance. Where possible LEG sites have also been established to span the ARM strings to examine stock-recruitment relationships. The design uses a 60 m long baseline transect marked by permanent SS eye bolts, with ten replicate 15 m x 1 m belt transects randomly located along the baseline. Randomised numbers (0 m to 60 m in 2.5 m increments) are used to determine the start position of the transect along the baseline and a randomised binary value (left/right) determines the direction of each 15 m belt transect perpendicular to the baseline. Sampling is non-destructive within the belt, and all abalone observed within the belt are measured to the nearest millimetre. Surveys of LEG sites are normally conducted on the same day as the ARMs whenever possible. Two additional sites are also deployed on the Tasman Peninsula and sampled annually when resources are available.
- The Gardens (GAR)
- Seymour Point (SEY)
- Munroes Bite (MUN)
- The Thumbs (THU)
- Betsey Island (BET)
- George III Rock (GEO)
- Black Reef boulder (BRB)
- Black Reef slab (BRS)

Abalone Recruitment Module (ARM) used to monitor cryptic juvenile abalone.
Data Analysis
Data extraction and filtering
A mirror of the NR&E Oracle catch and effort database is maintained by IMAS, inside its secure server farm. The mirror contains historic tables for data between 1985 and 1992, a static schema containing data from 1992 to 1997, and a dynamic schema containing data post 1997, with updates provided weekly. The catch, effort, vessel and fisher identity details are extracted via three views created in the IMAS mirror, and maintained by IMAS. Data are retrieved from the IMAS Oracle catch and effort database views via R statistical software R-Core-Team (2017) using the RODBC package (Ripley and Lapsley, 2015) for direct connection to databases. All filtering, error traps and subsequent analysis of the fishery-dependent data are undertaken within R. The first stage automates data extraction, filtering and removal of erroneous records, identification of doubling up (team dive) events, and preparation of mixed species effort values resulting in a working data set. The second data analysis stage, prepares data for and runs the CPUE standardisation, executes the empirical Harvest Strategy and produces a range of summary plots for the Abalone Fisheries Resource Advisory group meetings and the pdf Assessment document.
Quality Assurance
The catch and effort database contains a very small proportion of detectable erroneous records. The nature of the detectable errors are incorrect effort or catch values leading to impossible catch rates (e.g. > 500 Kg/Hr; no effort; complete duplication of records. A number of catch records (equivalent to approximately 200 tonnes) from the 1992 and 1993 fishing years had NULL values in the estimated weight field. As CPUE is calculated using daily diver effort and estimated weight, these records have previously been excluded from catch rate analyses. In 2019, an analysis of these records identified that the majority (> 90 %) were single day, single Sub-Block fishing events and therefore the landed weight could be substituted for estimated weight for the purposes of catch and effort analyses. These records are utilised in the assessment of trends from 1992 – to present, and included in summary figures and tables.
Standardisation
Catch per Unit Effort (CPUE: Kg/Hr) were standardised prior to use in the Harvest Strategy. Standardisation was completed using ther4cpueR package (Haddon unpublished) with the following base model;
CPUE = Year + Diver + Month + DoubleUps
All four variables are categorical and specified as Fixed Effects. The Doubleups variable identifies fishing events where two divers fish from same boat, usually on hookah with a T-piece. Geometric mean CPUE presented are always bias-corrected (BC), and standardised means are always displayed with 95% confidence limit error bars.
At this stage changes in size limits are not captured in the standardisation, although research on how best to achieve this is underway. Initial increases in size limits may decrease CPUE depending on the level of depletion of stocks. Size limit increases in the Tasmanian abalone fishery are usually in the order of a few millimetres at a time (although size limit decreases have often been in the order of 5mm and on occasions 13 mm), and animals that might have been taken at the start of the fishing year under the old size limit will usually grow through the size limit in under six months.
Treatment of Mixed Species Fishing Data
Mixed species (blacklip and greenlip) fishing occurs across a number of reporting blocks, but accounts for relatively little of the overall blacklip catch. Divers primarily target one species and take the other as a by-catch, but there are some locations where one species is targeted in the morning and the other targeted in the afternoon. Calculation of catch per unit effort (CPUE) is non-trivial when mixed species fishing occurs as several permutations of fishing practices are confounded with permutations in the way catch is reported.
For this assessment, the following adjustments were made to the effort component for calculating CPUE when mixed species fishing occurred (greenlip and blacklip abalone are landed on the same day by one diver);
• Where the target species accounts for less than 10% of the daily total catch, those records are excluded from the CPUE calculations for the target species.
• Where the bycatch is greater than 10% of the daily total catch, a new continuous variable containing the proportion of daily catch is added to the CPUE standardisation as an independent covariate.
• All records are retained for catch totals.


