

Harvest Strategy
An Empirical Harvest Strategy (HS) has been developed for the Tasmanian Abalone Fishery with the primary inputs being fishery-dependent catch rate data. This HS is based on a Multi-Criteria Decision Analysis (MCDA) framework, in the form of a simple weighted-sum approach. The HS has been reviewed (Buxton et al., 2015), and subjected to testing via Management Strategy Evaluation (Haddon and Mundy, 2016; Mundy et al., 2018b). This HS identifies aspirational targets for the fishery and attempts to manage the fishery towards that target. The HS is conditioned and run at the scale of individual reporting Blocks to arrive at a combined score, followed by a Control Rule to assign a recommended management action based on the combined score. Impacts of CPUE changes are taken into account when reviewing any changes in recommended biological catch suggested by the empirical Harvest Strategy.
Selection of Performance Measures
Over the past decade annual reviews of abalone fishery performance was through an expert driven, weight of evidence approach, considering magnitude of catch rates, trends in catch rates and spatial structure in the distribution of effort. The HS formalises the previously subjective process, by developing Reference Points (RP) for three Catch per Unit Effort (CPUE) performance measures (PM) previously evaluated in graphical form. In this assessment, the three performance measures used were:
- Target CPUE – the current CPUE scored against a target CPUE defined by Block
- Gradient1 – gradient of change in CPUE in the past 12 months (current year over the previous one year).
- Gradient4 – gradient of change in CPUE over the past four years including year to date.
Performance Measure Scoring Functions
The scoring functions incorporate targets and limits that are analogous to classical target and limit reference points. A scoring function is established for each PM, with the value of the PM (e.g. Target CPUE) scoring between 0 and 10. For all PMs the target is always a score of 5, with 0 implying the worst under-performance and 10 the highest over-performance. The reference period for determining the upper and lower bounds (0 and 10) for the scoring functions was restricted to catch and effort data between 1992 and the year preceding the current year i.e. for the 2019 assessment year, the reference period is 1992 –2018. Prior to 1992 there were substantial differences in the reporting and return of catch dockets, such that the recorded daily effort prior to 1992 is not considered sufficient for assessment purposes. The observed range of each PM was determined over the reference period, and then that range was extended by 10% in either direction. The rationale for extending the observed range is that within the reference period, fishing pressure has not led to biological collapse of populations, thus using the actual range observed would risk creating an overly conservative Harvest Strategy.
Learn more about the scoring functions for performance indicators (targets and limits) on our Stock Assessments Information Page.
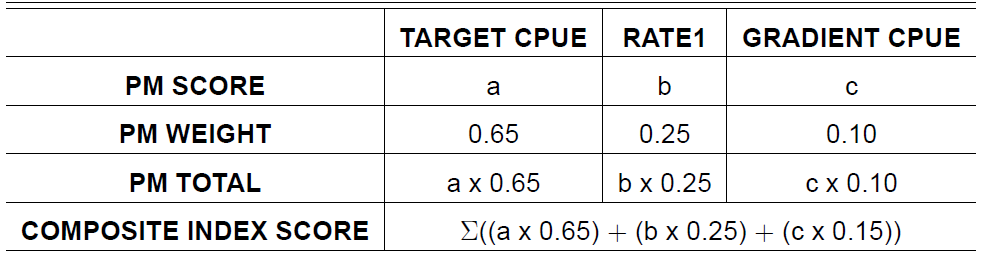
Performance Measure Weighting and Combined Score
A level of importance is assigned to each PM in the Harvest Strategy, by applying a weighting variable. The PM weights can be varied according to the preferred strategy, to emphasis or dampen the contribution of the PMs. For example in a rebuilding phase a higher weight is given to the CPUE Target PM, whereas once the fishery has reached the CPUE Target, this variable can be down-weighted, and emphasis placed on the Gradient 4 PM to maintain continuity. The final combined index of performance is then a sum of the PM score x PM weight, for all PMs.
Harvest Strategy performance measures and weights for this assessment
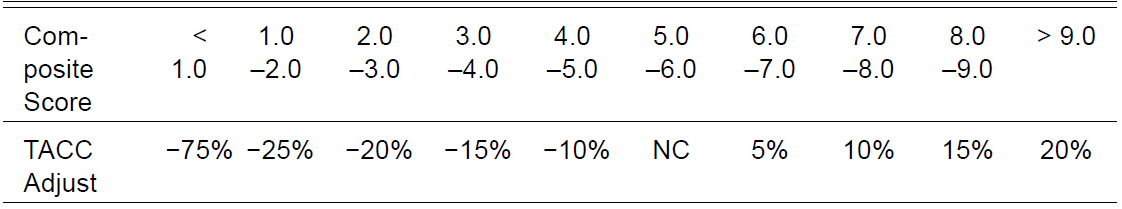
Control Rule for TACC Adjustment
A control rule system is applied to the composite score to determine the action to be taken. The control rule system proposed is based on a similar system suggested by Dichmont and Brown (2010). If the composite index score is close to the target score of 5, there is no change in TACC for a given spatial assessment unit (e.g. Block). A TACC reduction is required if the composite index score is less than 4.5, and a TACC increase may be taken if the score is greater than 6.
Where the control rule results in a TACC decrease, the Control Rule specifies the minimum reduction required given the Composite Score, whereas for TACC increases, the Control Rule specifies the maximum increase. TACC increase could optionally not be taken if arguments can be rationalised to support the status quo (e.g. market dynamics). The logic here is that for long-lived species such as commercially exploited haliotids where adult mortality is relatively low, from a biological stand point there is little to be lost in delaying a TACC increase by 12 months.
Control rule applied to combined performance management score.
Consideration of individual scoring systems, weighting coefficients, the control rules and any constraints are on-going through a series of formal workshops with experienced fishers. This Harvest Strategy has been tested by Management Strategy Evaluation (Haddon et al., 2014) and found to be effective. Ongoing testing and exploration of the properties of the Performance Measures used here and any new Indicators, determination of Reference Points and revision of Control Rules is essential.
Spatial Scale at which Harvest Strategy is Applied
Each reporting Block (= spatial assessment unit) within a fishing zone has a different long term productivity and catch rate, thus the harvest strategy is applied to each Block. The zone-wide TACC is determined by summing the recommended catch to be taken from each Block. The question arises about which Block catch should be modified to determine the projected Block catch for the following year. In practice, the TACC decision made in yeart for the fishing yeart+1 must be made in October of yeart. Thus the final catch and CPUE for a given block is not known at the time of the decision, and the CPUE analysis must be conducted on either partial year data (January – September), or the full years data from the previous year (i.e yeart−1). When the fishery is declining or rebuilding rapidly, then there is a strong argument and preference by Industry to utilise all available data especially the data obtained in the year to date. In terms of the Block catch value that the adjustment will be applied to, when the analysis includes the partial year data, then the allocated catch for yeart (defined during the assessment in yeart−1) will form the base value for Block catch adjustment.
Phase Plot Summary of Fishery Status Through Time
A benefit of applying an empirical Harvest Strategy using performance measures with defined reference points, is the capacity to use internationally accepted tools for summarising fishery status such as the ’Kobe Plot’. For an empirical HS with no direct estimates of biomass or fishing mortality, we must use proxies for B and F. Currently there is no accepted proxy biomass in abalone fisheries. Here we use the catch-weighted Target CPUE PM score as a proxy for abundance, and the catch-weighted four-year Gradient CPUE PM score as a proxy for fishing mortality. The zone-wide proxy score is calculated by taking the catch-weighted arithmetic mean of the individual block proxy score. An abundance proxy (Target CPUE) score of one is defined as the limit reference point (LRP), and a value of 5 is defined as the threshold reference point (TRP). A negative zone gradient score gives evidence that fishing mortality is increasing and the magnitude of the gradient provides some information on the magnitude of fishing mortality. In order to use this proxy to emulate a normal Kobe Plot, five is subtracted from the 4-year Gradient PM score to provide a score range of −5 to +5, where the limit reference point is zero. The combination of a negative 4-year gradient and near-record low CPUE Target score represents a cautious proxy for the true recruitment overfished reference point. No reporting blocks have collapsed within the reference period, providing a degree of certainty that the LRP is conservative, which is supported by MSE testing of the HS. Catch rate based proxies for abundance should not be considered as a direct measure of biomass. Rather, we believe catch rates are a measure of the parity between the TACC and the available exploitable biomass.